Table of Contents >> Show >> Hide
- What the Hackaday build actually shows (and why makers love it)
- Spectrometer vs. spectrophotometer: the “don’t get yelled at in the comments” version
- The anatomy of a budget spectrometer (a.k.a. how to turn photons into a graph)
- Slit width: the quiet king of resolution, brightness, and heartbreak
- Calibration: turning “rainbow vibes” into real measurements
- What you can actually do with an inexpensive spectrometer
- Common pitfalls (and how to avoid turning your spectrometer into a disappointment machine)
- When you don’t need a full spectrometer: the rise of “spectral sensor” boards
- Conclusion: inexpensive and capable is a design philosophy, not a price tag
- Experiences from DIY spectrometer builds (the good, the weird, and the “ohhh” moments)
There are two kinds of people in the world: those who see a light source and think “bright,” and those who see a light source and think
“what are you hiding in there?” If you’ve ever leaned toward the second camp, Hackaday’s feature on an inexpensive, capable DIY
spectrometer build is basically a permission slip to go full science goblinwith a laser cutter, some aluminum tape, and a suspiciously
serious respect for the color green.
The punchline is simple: you don’t need a lab budget to do meaningful spectroscopy work. You need a clean slit, a decent diffraction grating,
ruthless control of stray light, and a way to capture and interpret the spectrum (often with a webcam or camera-as-detector approach). The
Hackaday build nods to a “NanoDrop-style” form factor, but the bigger story is what it teaches: spectrometry doesn’t have to be fancy to be
usefulit just has to be disciplined.
What the Hackaday build actually shows (and why makers love it)
The featured project walks through building a compact spectrometer-style device in a wooden enclosure, with practical notes about what matters
in real life: blackening the interior, improving reflectivity where needed, and making sure the slit is sharp enough to avoid turning your
spectrum into a watercolor painting. Hackaday calls out small-but-important build detailslike using aluminum tape for a slit (and why you may
eventually want razor blades for cleaner edges), and the value of truly matte black coatings inside the optical path to suppress reflections.
The build demo also delivers a classic “oh wow” moment: a green laser pointer produces a sharp peak in greenand a second peak in the infrared
range. That’s not just cool; it’s a practical reminder that what you see isn’t always what you’re getting, especially with inexpensive optics.
In other words, your DIY spectrometer can double as a truth serum for bargain-bin light sources.
And then there’s the aspirational angle: spectrophotometry isn’t only about pretty rainbows. It’s about fingerprintsmissing bands, sharp
peaks, and spectral shapes that can help identify materials or estimate concentrations when the setup is controlled.
Spectrometer vs. spectrophotometer: the “don’t get yelled at in the comments” version
In casual maker conversation, “spectrometer” often becomes shorthand for anything that spreads light into wavelengths and records the result.
Strictly speaking, a spectrometer measures intensity versus wavelength. A spectrophotometer usually implies a
measurement setup designed for quantitative optical properties (like absorbance or transmittance), often with a controlled light source,
defined path length through a sample, and calibration routines.
The Hackaday project lands in the maker-friendly middle: it’s a spectrometer-style instrument that can be used toward spectrophotometry if you
add repeatable sample handling, a stable light source, and calibration/blanking practices. That’s not a nitpickit’s a roadmap.
The anatomy of a budget spectrometer (a.k.a. how to turn photons into a graph)
1) The entrance slit: tiny, picky, and absolutely in charge
The slit defines what “sharp” even means in your system. A narrower slit improves spectral resolution (you can separate close wavelengths
better), but it also reduces light throughput (your signal gets dimmer). A wider slit gives more light, but smears the spectrum. This trade-off
is so important that many commercial instruments treat slit width as a configurable design decision, not a footnote.
2) Collimation optics: making the light behave before you split it
After the slit, you typically want the diverging light to become more collimated (more parallel) so the dispersive element (grating or prism)
can do its job predictably. Some designs use lenses; others use mirrors. Either way, the goal is the same: tame the beam before you ask it to
separate into wavelengths.
3) The dispersive element: diffraction grating is the hero ingredient
A diffraction grating is what makes many modern “small and serious” spectrometers possible. It spatially separates wavelengths so that a
detector can see them at different positions. Makers often encounter gratings as films or sheets (cheap and surprisingly effective), as
salvaged components (CD/DVD-based gratings show up in many classroom and hobby builds), or as dedicated optics that offer better efficiency and
consistency.
The Hackaday build notes that a purchased grating is typically inexpensive and convenient, while an unpainted CD can work in a pinch. Many DIY
kits and educational builds use the grooved structure of optical media (especially DVDs) as a workable grating substitute when the goal is
learning, experimentation, or “good enough” spectral separation.
4) The detector: webcam, phone camera, or linear sensorpick your compromise
Commercial spectrometers often use linear CCD/CMOS arrays tuned for spectral work, but DIY builds frequently repurpose cameras. The basic idea
is elegant: spread wavelengths into a line, capture that line as pixel intensities, then map pixel position to wavelength.
The upside: cameras are cheap, accessible, and easy to interface with. The downside: consumer cameras have their own spectral sensitivity,
color filters, automatic processing, and noise behaviorsso careful configuration and calibration matter if you want more than “pretty picture.”
Slit width: the quiet king of resolution, brightness, and heartbreak
If your spectrum looks muddy, the slit is often the culprit (or the way the slit is made). Clean edges matter because ragged edges behave like
tiny extra slits and scatterersblurring the signal before it even reaches the grating. That’s why builds often start with “aluminum tape slit”
but graduate to more precise approaches like razor blade apertures when builders get serious.
Practical rule of thumb: start with a workable slit that gives you enough light to focus and align the optics, then narrow it down in stages
as your alignment and light control improve. A perfect slit won’t fix a leaky light boxbut a leaky light box will absolutely sabotage a
perfect slit.
Calibration: turning “rainbow vibes” into real measurements
Step one: calibrate wavelength using known spectral features
Calibration is where DIY spectrometry becomes science instead of art. You need at least a couple of known wavelengths to map pixels to nanometers.
Makers commonly use fluorescent lights (which have distinct spectral lines) as a convenient reference source, and many DIY workflows recommend
pointing the instrument at a CFL-style bulb during calibration.
Once you can identify known lines (for example, common strong lines used as references), you can build a simple mapping between pixel position
and wavelength. With enough reference points, you can correct for nonlinearity too.
Step two: intensity sanity checks (dark frames and repeatable exposure)
If you want intensity to mean anything, you need consistency: lock exposure, disable “auto” behaviors where possible, subtract a dark frame,
and keep geometry stable. Even then, camera sensors don’t have uniform sensitivity across wavelengths, and many systems need a correction curve
if you’re comparing intensities across the spectrum.
Step three: don’t ignore path length if you want absorbance
Hackaday’s “NanoDrop-style” reference is helpful here: quantifying concentration via absorbance depends on a defined optical path length through
the sample. If the distance the light travels through your sample varies, your absorbance estimate varies, too. For qualitative work (“is this
dye absorbing in the blue?”), you can be looser. For quantitative work, you need repeatability.
What you can actually do with an inexpensive spectrometer
Spot-check LEDs, lamps, and “white” light sources
LEDs are famous for being “white” in the most technical sense of the word: sometimes they’re a blue LED plus a phosphor that fills in the rest.
A spectrometer makes that obvious. You can compare warm-white and cool-white LEDs, identify narrow peaks, and see how different bulbs produce
radically different spectral power distributions.
Detect surprises in lasers (including infrared leakage)
The Hackaday demo showing a green laser with an additional infrared peak is a maker-friendly reminder that cheap laser pointers can have
complicated emission behavior. A spectrometer won’t just tell you “green”; it can show you extra components that matter for experimentsand for
safety planning.
Do “starter” spectrophotometry with dyes and pigments
With a stable light source and controlled sample setup, you can explore absorbance changes in colored solutions (think food coloring, safe dyes,
or plant pigments in solution). The goal isn’t to replace a lab instrument on day one; it’s to build intuition: how absorbance curves shift with
concentration, how scattering makes things messy, and why calibration and blanks exist.
Explore reflection “fingerprints” (a gentle intro to materials ID)
Reflection spectroscopy can highlight differences between surfacespaint pigments, plastics, paper stocksespecially when you control illumination
and geometry. Even a coarse spectral signature can help you compare “same-looking” materials that behave differently under the hood.
Common pitfalls (and how to avoid turning your spectrometer into a disappointment machine)
Stray light is your sworn enemy
If light leaks into the enclosure, your detector will happily record it and pretend it’s part of the spectrum. Matte black interiors, tight seams,
and thoughtful baffles matter more than most first-time builders expect.
Alignment beats expensive parts
A fancy grating won’t rescue a misaligned optical path. Take the time to square the slit, align the grating angle, and ensure the spectrum falls
cleanly on the sensor. Small adjustments can change your spectrum dramatically.
Don’t let software “help” you into bad data
Auto-exposure, auto-white-balance, and “enhancement” features can quietly distort results. If you want measurements, you want control.
Lock settings and keep them fixed between runs.
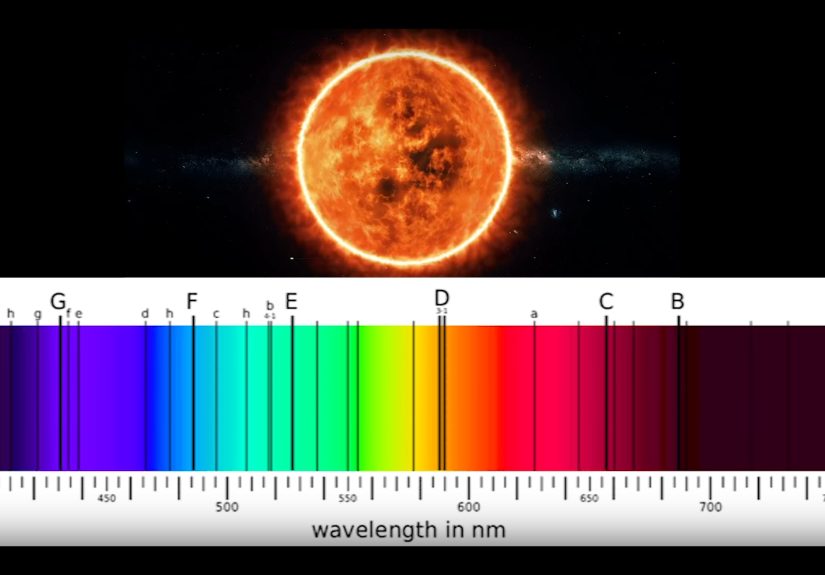
Beware the urge to stare at the sun
Don’t point improvised optics at the sun, and don’t assume your eyes or camera are safe without proper filtering. DIY spectrometers are for
controlled light sources and safe measurement setupsnot casual solar observation.
When you don’t need a full spectrometer: the rise of “spectral sensor” boards
Not every project needs a full continuous spectrum. Sometimes you want a handful of wavelength bands (multispectral sensing) to classify a surface,
compare light sources, or estimate reflectance features. That’s where compact spectral sensor boards can shine. They measure discrete channels across
UV/visible/NIR bands and can be easier to integrate into embedded projects than a full optical bench.
The trade-off is obvious: you get convenience and repeatability, but you don’t get the detailed spectrum shape a grating-based system can provide.
For “is this closer to LED A or LED B?” a multispectral sensor can be perfect. For “what are all the peaks and gaps?” you still want a spectrometer.
Conclusion: inexpensive and capable is a design philosophy, not a price tag
Hackaday’s “Spectrometer Is Inexpensive And Capable” lands because it treats DIY spectrometry like a real instrument-building problem, not a craft
project. It emphasizes the practical truth: the performance of a low-cost spectrometer comes from fundamentalsslit quality, light control,
alignment, calibrationnot from how intimidating the enclosure looks.
Build it for curiosity first. Then improve it with intention. And when you get your first clean, calibrated spectrum that actually matches what
physics says should happen? Congratulationsyou’re no longer just looking at light. You’re reading it.
Experiences from DIY spectrometer builds (the good, the weird, and the “ohhh” moments)
Makers who build inexpensive spectrometers tend to report the same emotional arc: excitement, confusion, obsession, then quiet satisfaction. The
first “spectrum” often looks like a smeared rainbowpretty, but not useful. That’s usually when builders discover the three big levers:
slit quality, stray light control, and repeatable alignment. A lot of early wins come from
unglamorous fixes: taping seams, adding baffles, repainting the interior, and narrowing the slit after the optical path is stable.
A common early experiment is comparing household bulbs. Builders will point the spectrometer at a CFL and see sharp spikes that look like a
barcode. Then they’ll point it at an LED bulb and see a strong blue peak plus a broad “phosphor hill” that fills in the greens, yellows, and reds.
It’s one of those moments where you stop thinking of “white light” as a single thing and start thinking of it as a recipe. That single comparison
can change how people shop for lighting, especially if they care about color rendering or photography.
Another frequent “maker rite” is testing cheap laser pointers. Builders often expect one spikeend of story. But the data can be more interesting:
a narrow visible peak plus unexpected energy elsewhere (including infrared components in some cases). The experience tends to produce a very specific
reaction: laughter followed by caution. People start taking filtering and safety more seriously, especially when they realize their eyes can’t warn
them about wavelengths they can’t see.
Once the hardware feels steady, a lot of builders move into simple spectrophotometry-style experiments with safe colored solutions. The first lesson
is that “just measure it” is harder than it sounds. If the sample thickness changes, the graph changes. If the light source drifts, the graph changes.
If the camera auto-adjusts, the graph changes. So the “experience” becomes as much about learning good measurement habits as it is about optics:
taking a blank, keeping geometry fixed, and running multiple trials to see what’s stable versus what’s noise.
In classrooms and home labs, DIY spectrometers also create a powerful kind of curiosity because they reward questions with evidence. “Do two blue LEDs
really look the same?” “Is this ‘warm white’ actually missing cyan?” “Why does this fluorescent tube look harsh?” Instead of arguing, you measure.
And because the tool is inexpensive, people are willing to experiment aggressivelyswap gratings, try different slit widths, tape on a phone mount,
rebuild the enclosureuntil the instrument becomes theirs.
The most satisfying experience, though, is when a builder stops treating the spectrum as a novelty and starts treating it as data. That’s usually
the day they calibrate successfully, recognize known spectral lines, and see the wavelength scale line up consistently across sessions. It’s not a
flashy momentno confetti, no choirbut it’s the difference between “I built a thing” and “I built an instrument.”